
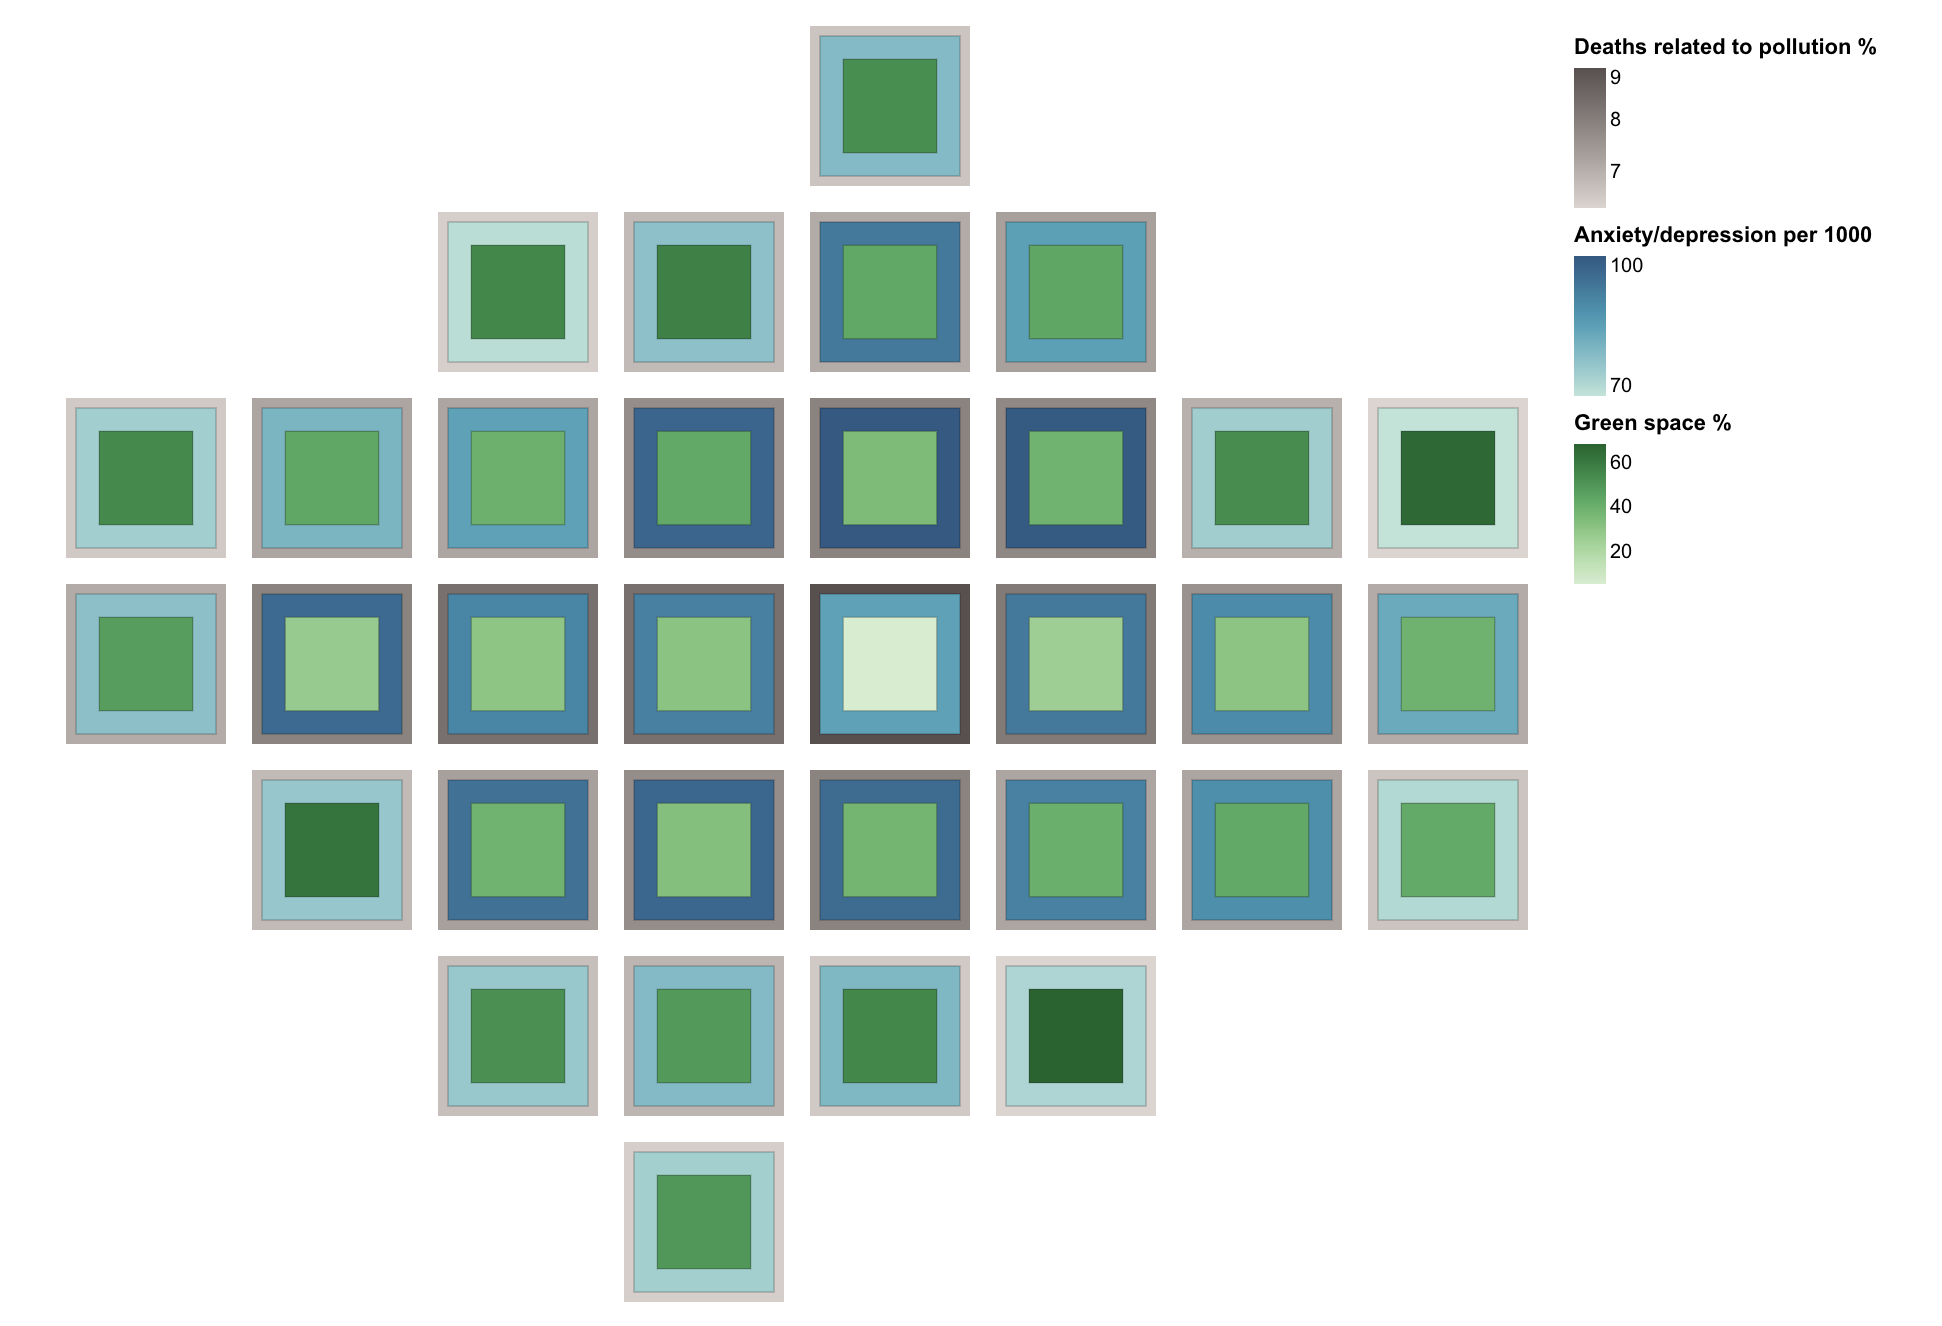
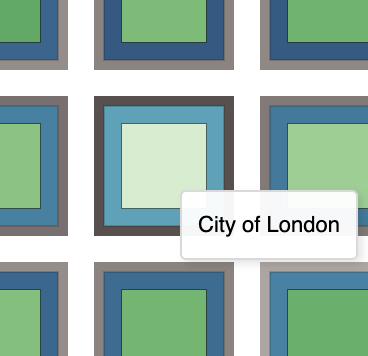
Final Design
This is the main data visualisation produced, the method of how this design was produced will be detailled in the below sections.
Challenge
Manipulate a dataset to produce effective data visualisations to answer research questions that can't be just done through simple spreasheet software. The design choices should be backed up by literature and should include the 'human in the loop'.
Research questions
- Is there a relationship of the location of green space and the wellbeing of residents in London?
Design choices
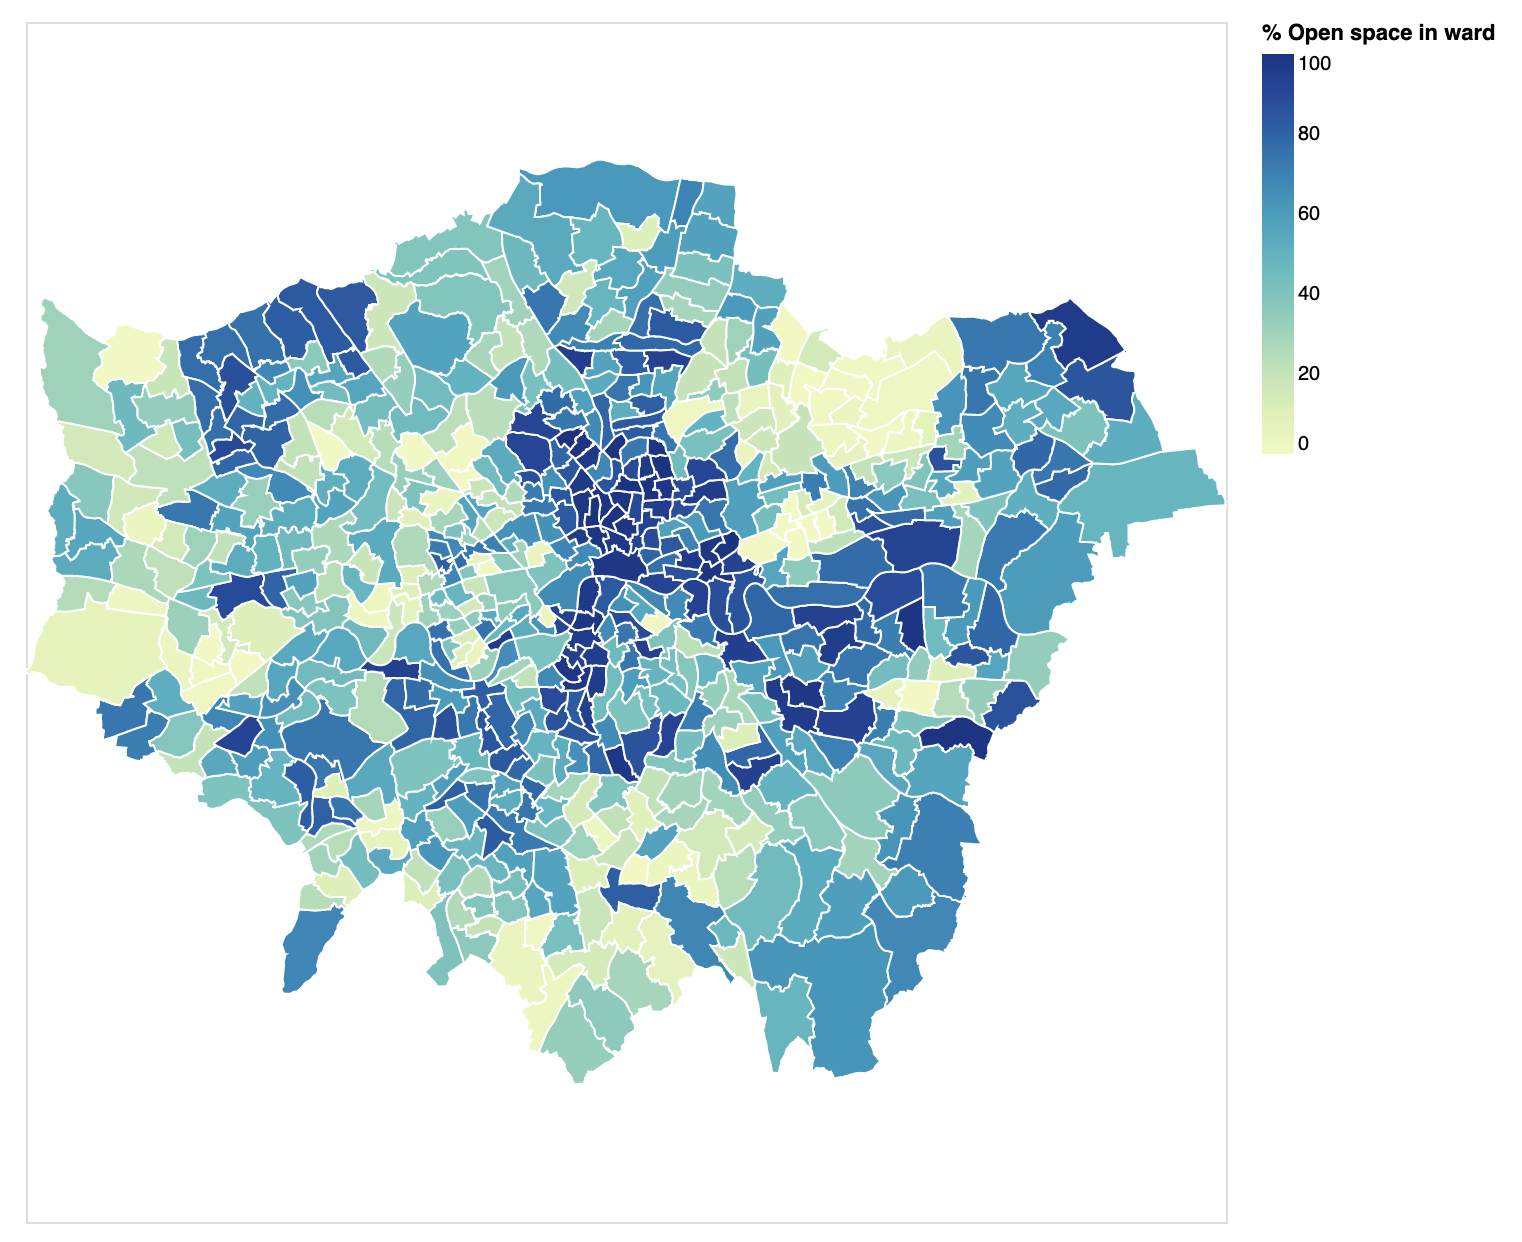
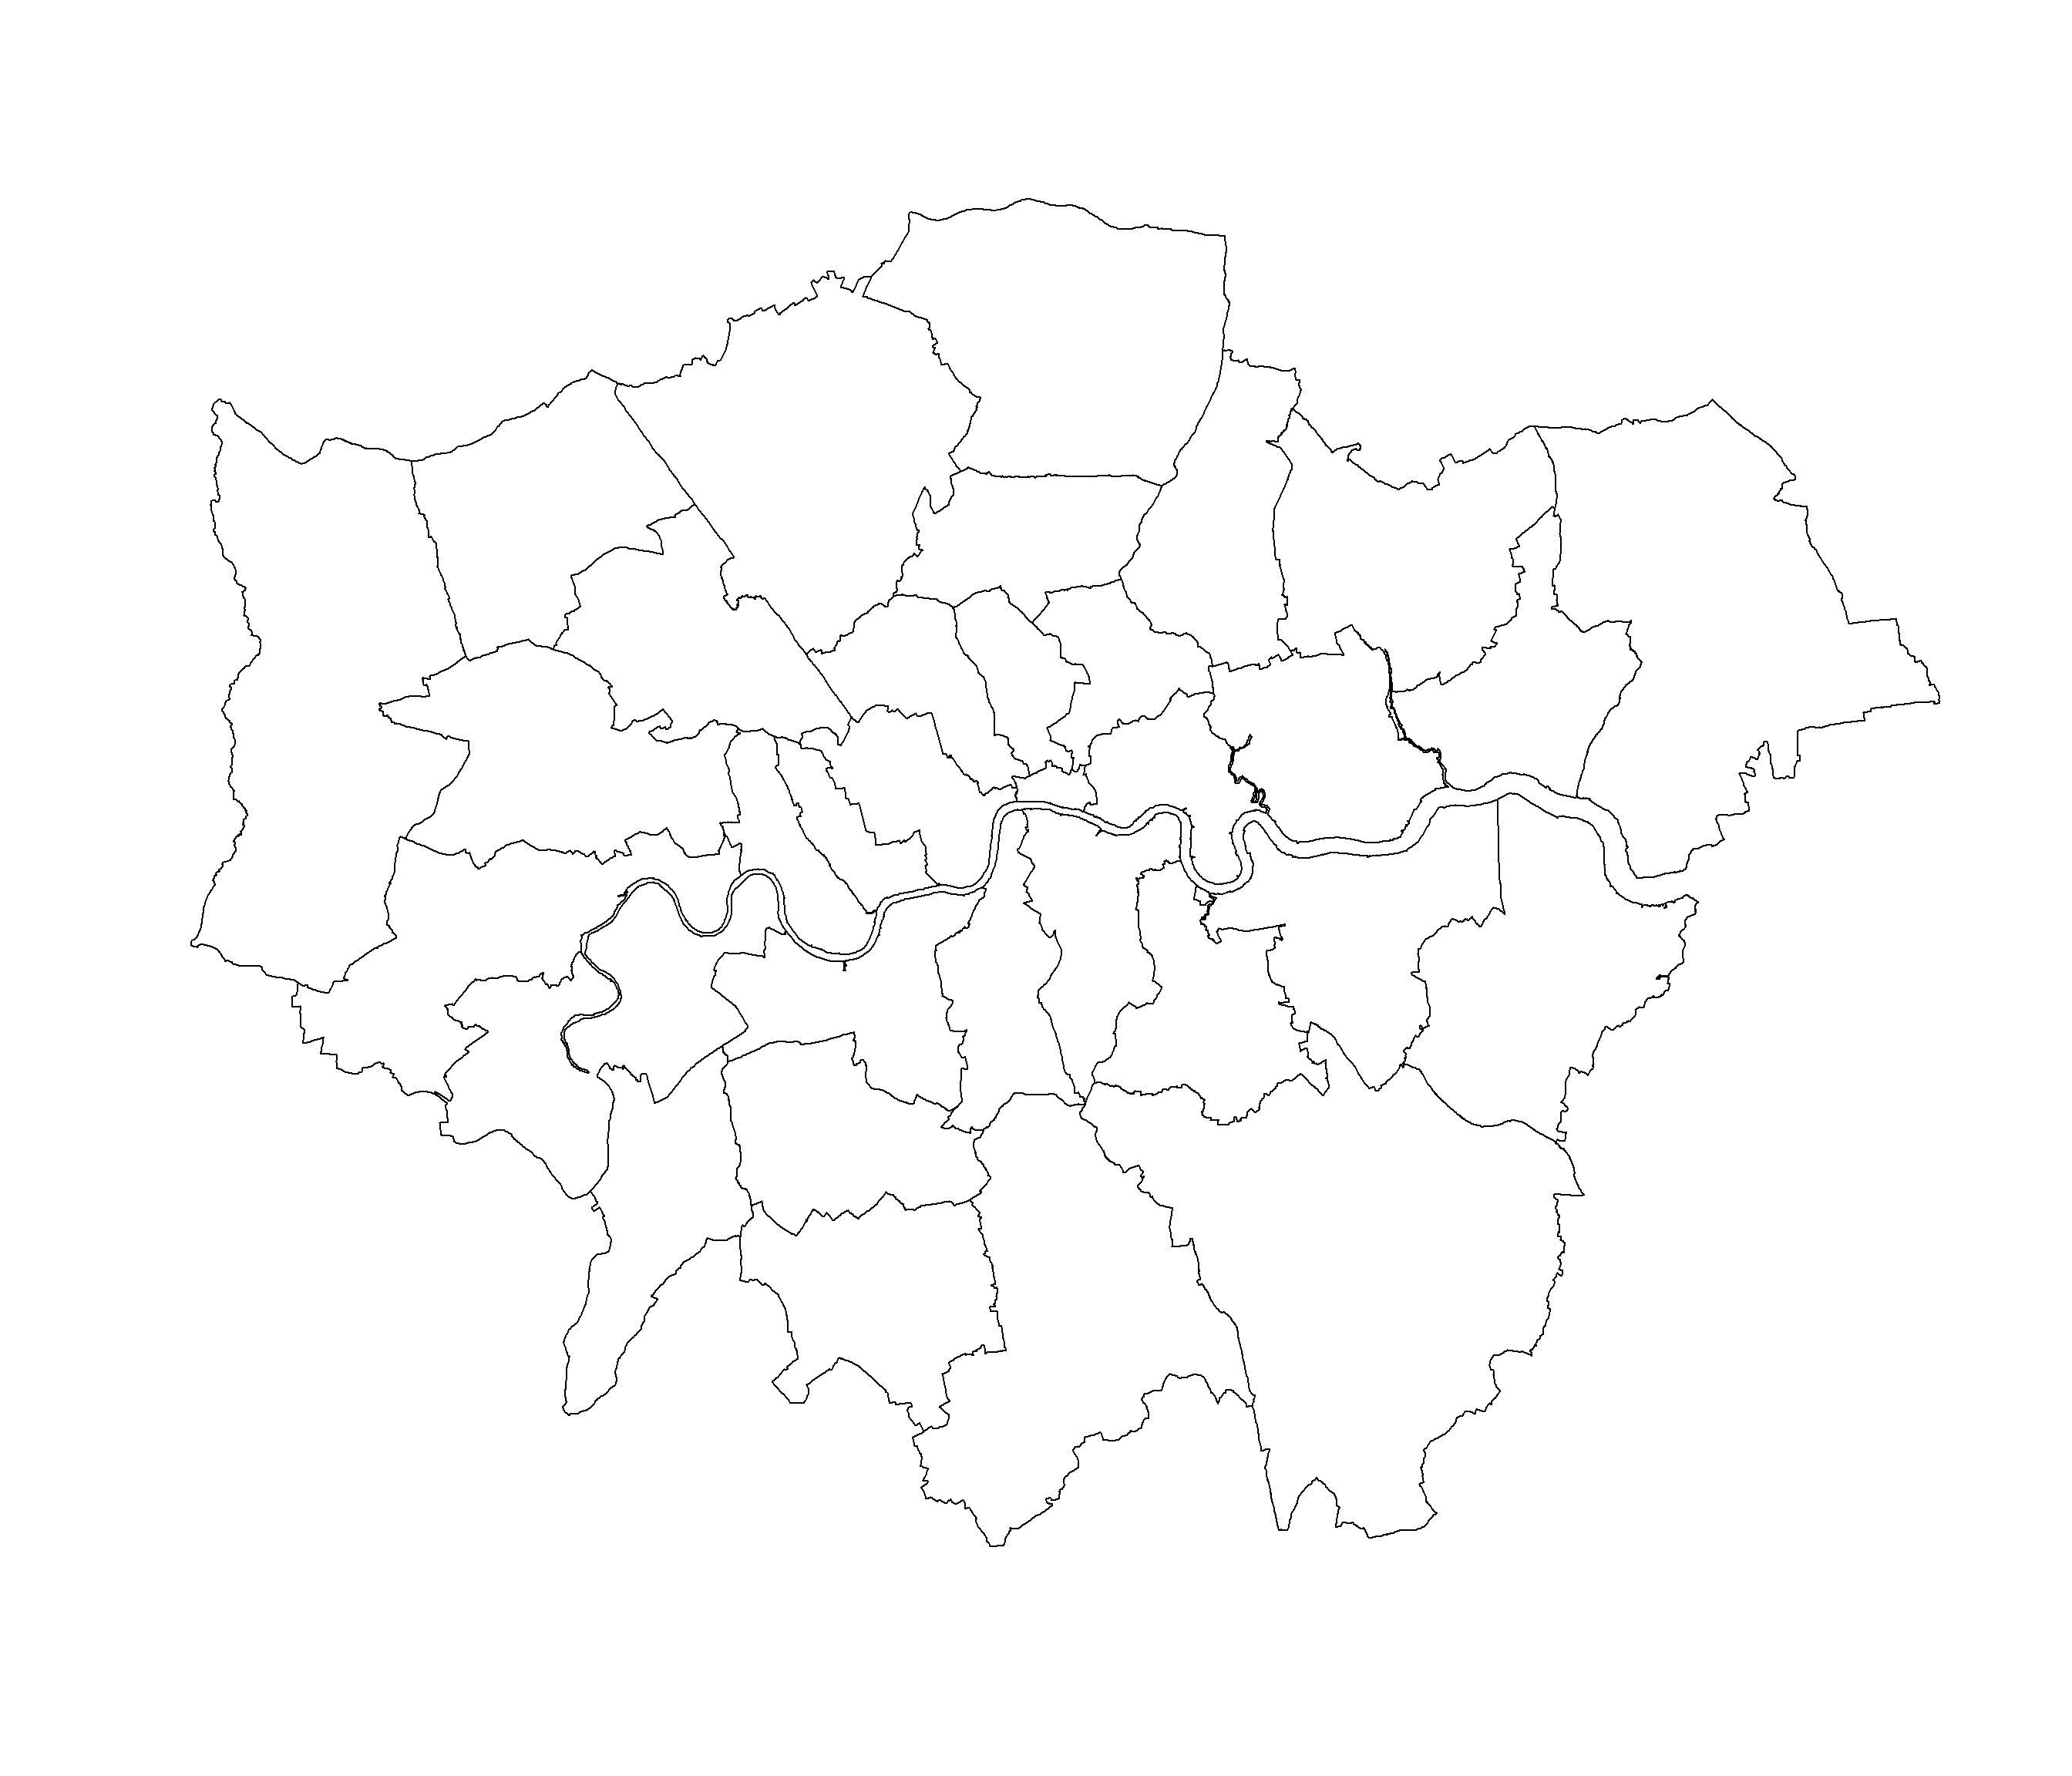
- London was split by its 32 boroughs. Initially, it was planned to be split by its 626 wards, which generated too many data points - this made the visualisation too difficult to interpret.
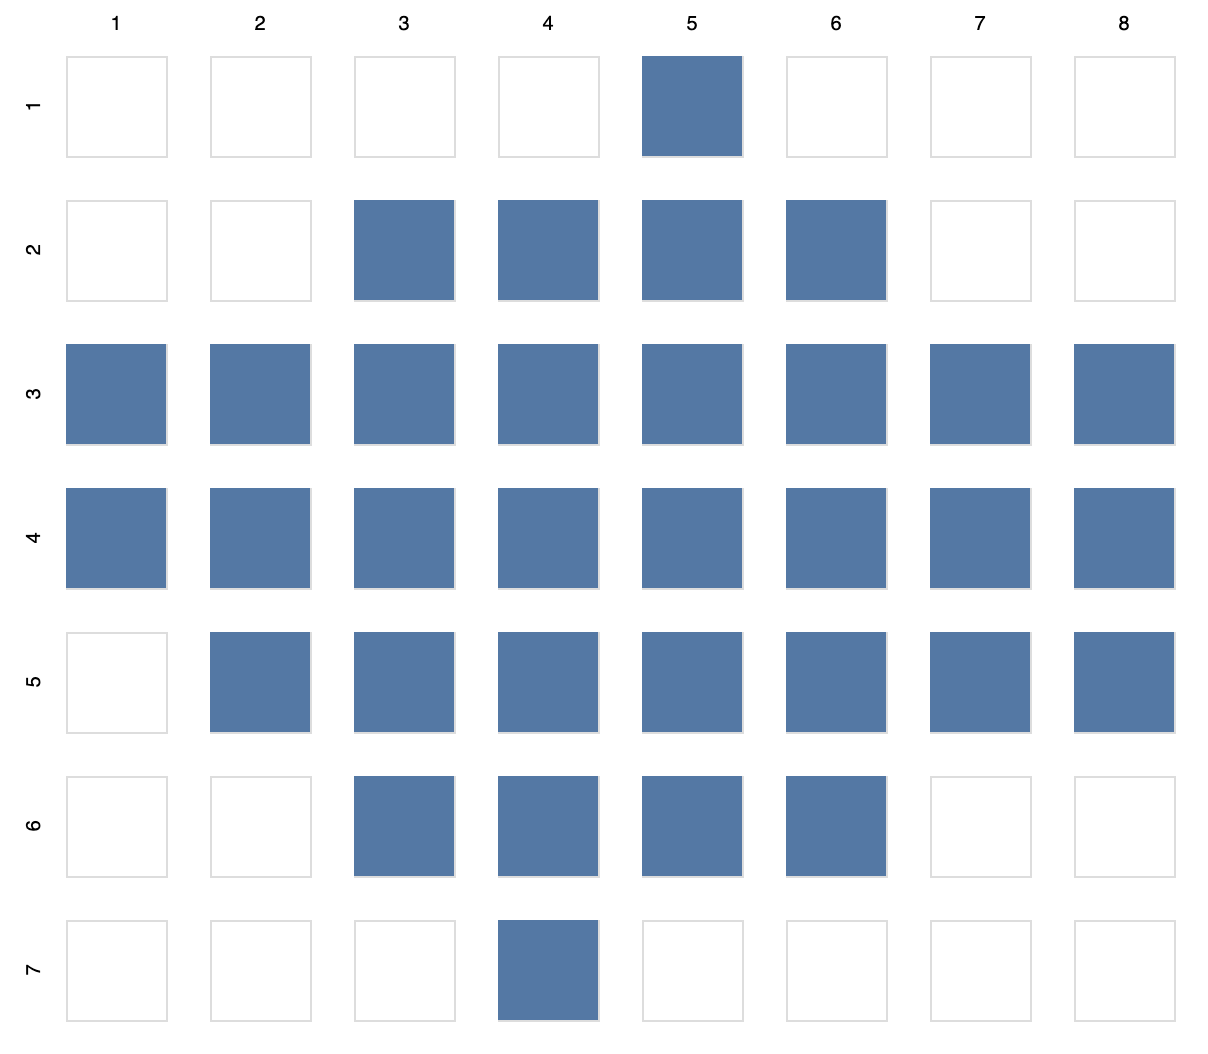
- The geographic layout for London was relaxed, a grid format was chosen. The positions of the boroughs are relatively in the same position in terms of locatiion and neighbouring boroughs. This does remove accuracy for the visualisation, however it opens new possibilities and space to create better and more meaningful insights.
- Differenet parameters were tested for example "happiness", "pollution related deaths", "household income", "anxiety and depression ", etc... Some of the parameters showed their was a trend geographically
- The parameters that showed a trend were overlapped over each other, to help see more complex insights in how green space can affect the wellbeing of residents living in London
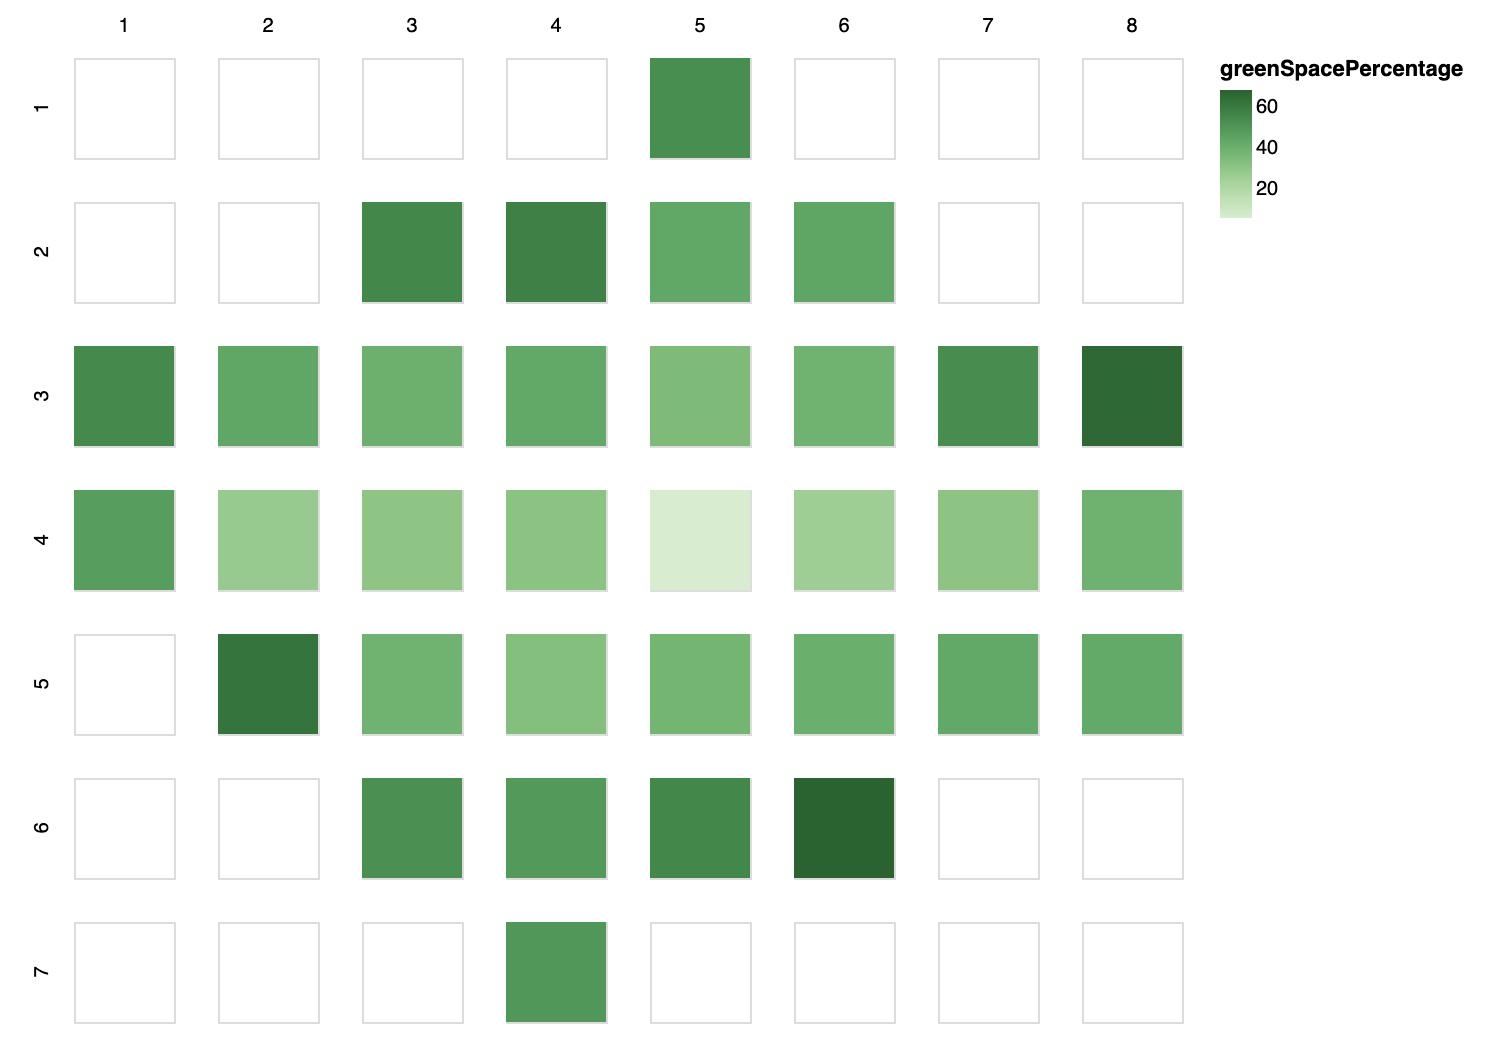
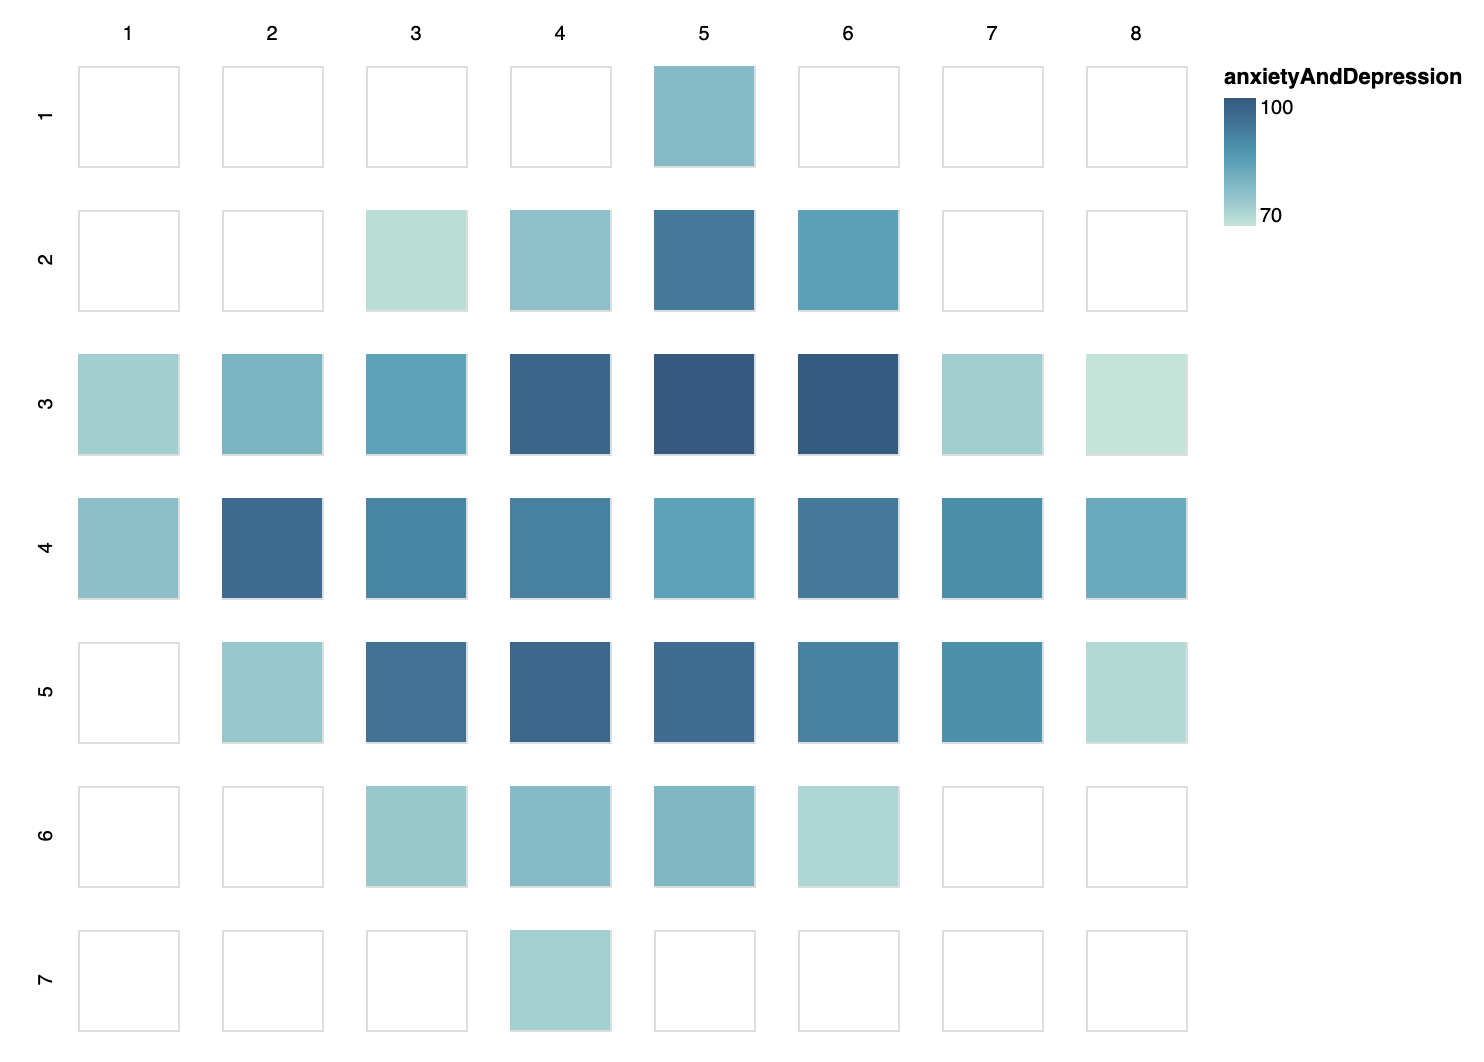
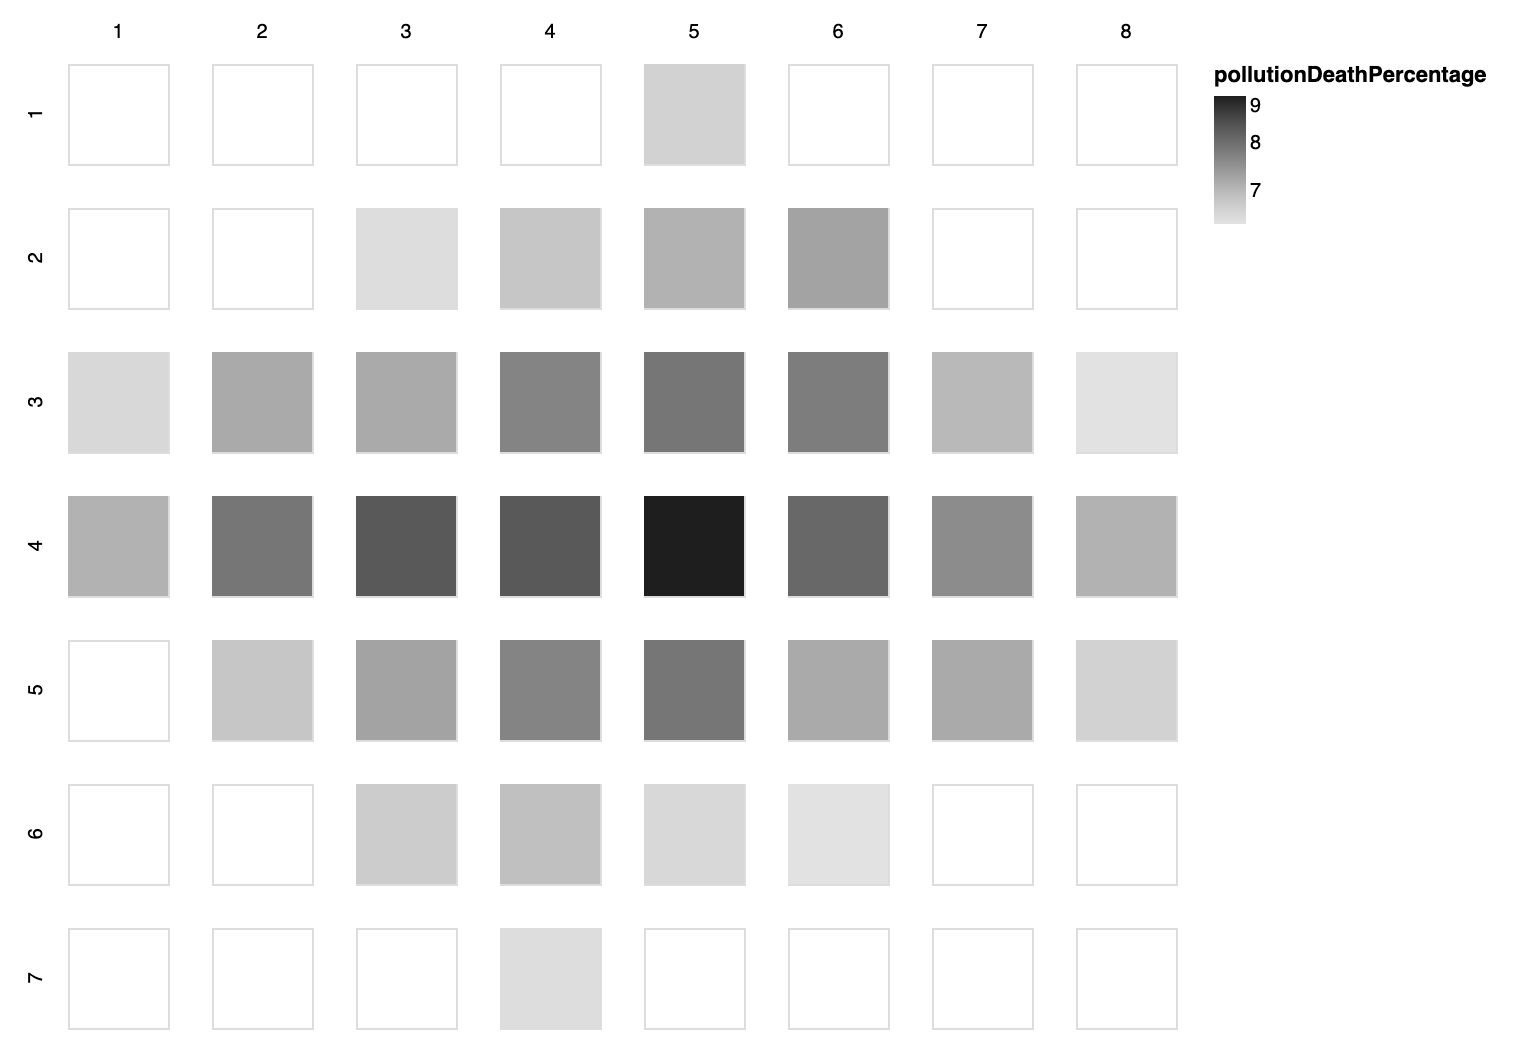
- The colour lightness of each parameter was used as the scale for how prevalent that parameter was in that borough.
- Each colour for the parameters was chosen carefully so that they were associatable. Green space % was green colour, anxiety and depression % was blue and deaths related to pollution was grey colour.
- Tooltips were added, where the user can hover above the tiles in the map, where they will be displayed the borough name and the exact value for each parameter. This helps the users who want to explore the data further and does not intrude wiith the aesthetics of the design
Insights
- The green space gradually increases as you move further from the centre of London. This is expected as these areas are more built up for buildings and roads. More space is available for green space in the outer boroughs.
- Anxiety and depression decreases as you move futher from the centre of London. This shows their may be an association with the amount of green space and anxiety and depression.
- Deaths related to air pollution decreases as you move further from the centre of London. Hence, the more green space may be an indicator of less likelihood of death related to pollution. The outer boroughs will have less land used up for roads which contribute to the pollution in the air.